
In case you missed it see what’s in this section
We recommend

eating & drinking
Sponsored by

lifestyle
Sponsored by

entertainment
Sponsored by

Business
Sponsored by
jobs
Sponsored by
property
Sponsored by

family
Sponsored by
shopping
Sponsored by
sport
Sponsored by
motoring
Sponsored by

Your Total Guide To Business

As a social media marketer sometimes other (jealous) people walk past you while you’re working, see you on Facebook and just assume that you’re bunking off. In reality, it’s full of planning, drafting and scheduling posts and measuring their effectiveness – among lots of other things.
But how do you know what you’re doing well and what you need to improve on? How do you communicate the ROI from all your hard work on social, to those who don’t necessarily understand its place in modern marketing?
I’m going to show you six simple steps to create your very own Analytics Report, and it’s not as daunting as you think!
1. Export Data
Facebook and Twitter both let you download your data as a .csv file, which can be opened in Google Sheets, Numbers or good old Excel. This can be found in the Insights or Analytics pages on each platform. You’ll be able to define the date range that your data comes from; a week, a month, a quarter etc. Download the date range that makes sense to you (we do it monthly), save it to your laptop and open it in your favourite spreadsheet program.
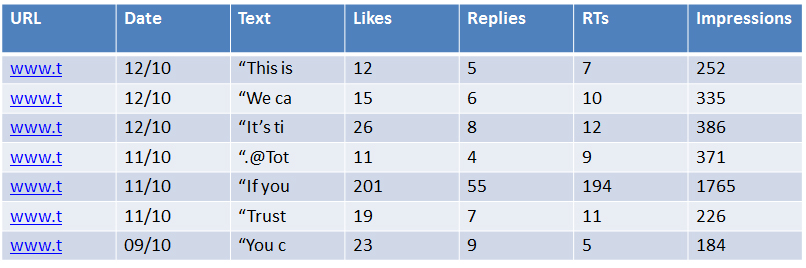
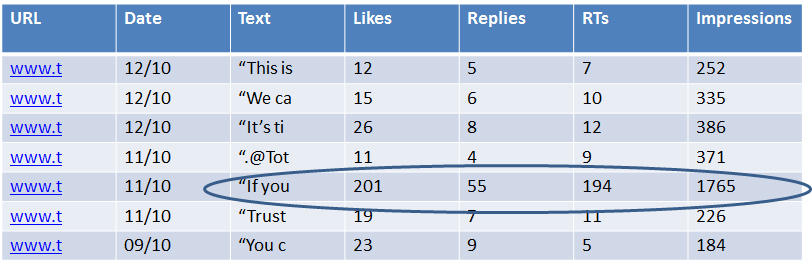
2. Remove Unnecessary Data Points
Now you have a massive amount of data to look at, it’s time to start stripping out the numbers that you’re not going to be measuring. A really important point to remember here is that these numbers work for you, so don’t get bogged down by the sheer volume of information, just focus on the data points that actually help measure your targets. Normally engagement (likes, retweets etc) and reach are the most important. You might also want to remove posts that you don’t want to count towards your stats.
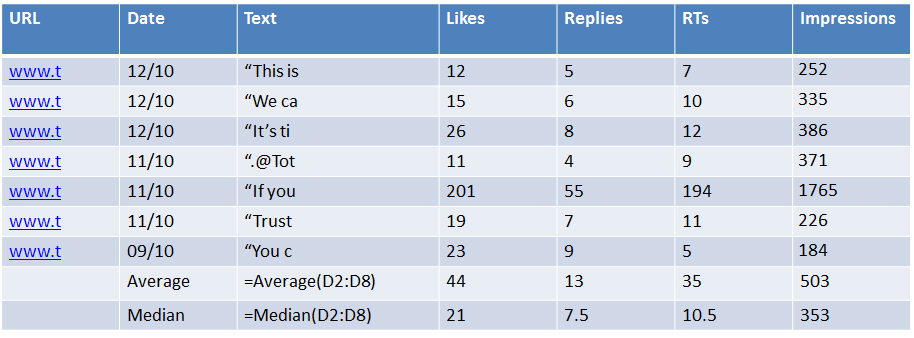
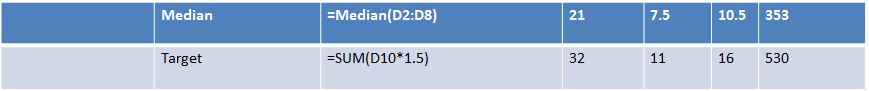
3. Find Averages
The average number of engagements and click throughs that your social posts gets is a really useful number to have. At a glance you’ll be able to tell if a post you’ve just published is performing above or below expectations. It’s as simple as totalling up all the stats and diving them by the amount of posts. Don’t forget to add a median average to take in to account outliers and rogue pieces of viral content.
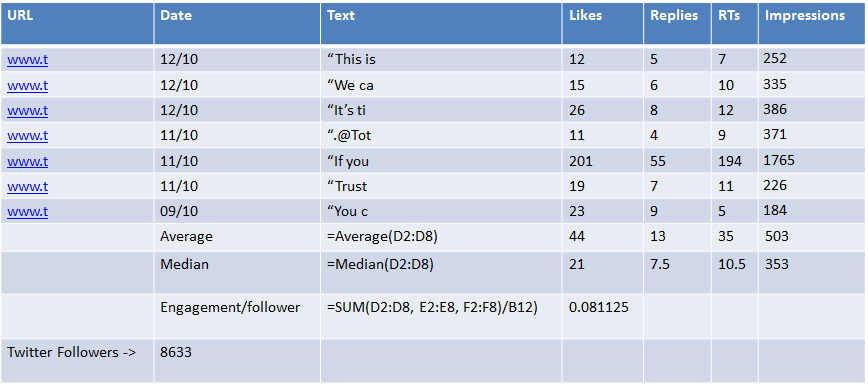
4. Add Rates of Measurement
If you really want to take it to the next level, add rates of measurement to your data. Knowing your engagement rate per follower is useful for comparing pieces of content across different platforms with different sized audiences. For example, a post with 100 likes on Facebook is great where you have 5,000 fans, but 100 likes on an Instagram page with 10,000 followers, it’s not as popular. Measure your engagment per follower and engagment per impression.
5. Set Targets
A really easy way to start off targeting your social media content is to multiply your averages by 1.5, this will give you a number to shoot for which is over and above your current performance. When you start hitting that target more often that you’re not, time to move the goalposts and aim higher.
6. Add Context
Once you’ve got all the numbers in a nice, tidy report you can start seeing patterns in the data and attributing spikes in activity to particular posts. Coming up with answers for why pieces of content performed well, be it timing them in with a trending topic, making sure the right types of content go to the right platform, or whatever, will give you a clear sense of what works well, meaning you can do more of it.
This is, of course, just a very quick guide to how you can create an Analytics Report. You may still have questions about which data points to track and why, as well as what else Analytics can show you. If you have any further questions, email me any time at [email protected]


We recommend


In case you missed it see what’s in this section
Listings